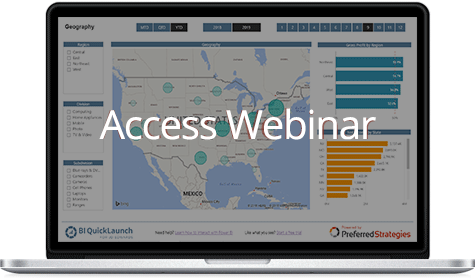
Are you looking for easy-to-use tools that provide actionable and interactive ways to analyze JD Edwards data? Attend this webinar to see how Microsoft’s latest tools make these objectives a reality.
The future of business intelligence (BI) does not lie on the shoulders of IT. Rather “modern” BI strategies must enable every business user to take advantage of familiar self-service software solutions to create, analyze, share, and consume actionable insights into organizational data without having to submit a help-desk ticket. In order to accomplish this, business users need analytics tools that provide real-time access to JDE data, are easy-to-use, powerful enough to handle the advanced needs of the business, integrated with JDE and other business applications, and cost-effective to meet the budget of any size organization.
In this demo-filled webinar you will discover the synergy between Microsoft Excel, Power BI and the entire Microsoft BI “stack”. Go under the hood of PowerBI, Microsoft’s latest Dashboard, Data Discovery and Visualization software designed for business users to develop their own interactive dashboards using drag and drop (ad hoc) functionality and natural language query technology. Users familiar with Excel and other Office software programs can quickly transfer their skills to building reports and visualizations with Power BI.
Whether or not you consider Microsoft Excel your best friend or worst enemy, it is still the most heavily used reporting and analytics software by companies today. With over 200 million users worldwide, the likely hood of this trend changing is minimal. Join us to see how to transition from spending tedious hours in Excel, to having your JD Edwards data updated and readily available to analyze in seconds with SSAS Tabular, PowerPivot, and Power BI models.
After this educational session you will learn how Microsoft has tightly integrated the underlying infrastructure of Excel and Power BI. Also, you will understand how the latest Microsoft technologies can enhance the effectiveness and impact of your business intelligence initiatives.
Attend this session to:
- Discover the benefits of the “In-memory” data modeling capabilities of PowerPivot and Tabular SSAS cube, which allow customers to analyze the results of millions of rows of JD Edwards data quickly and easily within Excel and Power BI
- Quickly and easily connect to JDE data using Excel and Power BI to analyze data and develop easy-to-consume visualizations that provide actionable insights
- Build “drag and drop” visualizations and dashboards over JD Edwards data in minutes with Microsoft Power BI


